Volatility spread guidance is itself volatile lately
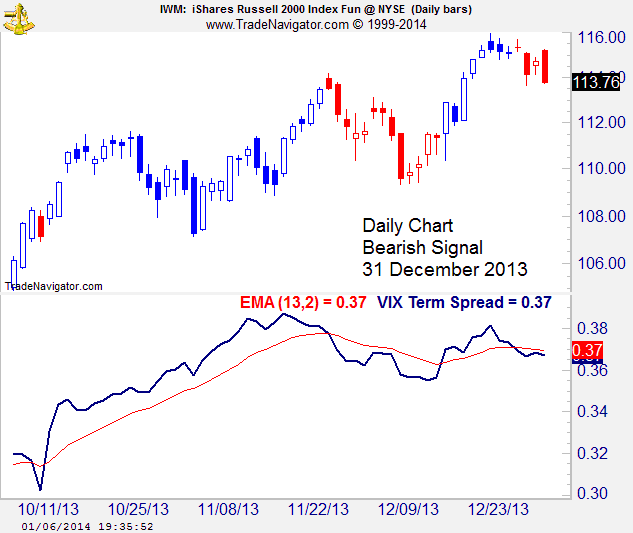
Stocks have been marching in place, making trend guidance volatile. I have been letting things ride against 115.71, the high of the bearish signal of 31 December 2013.
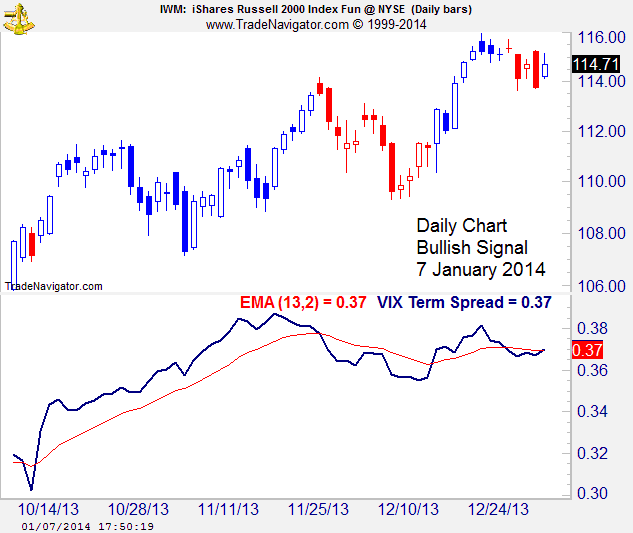
Volatility Spread Guidance Wavering
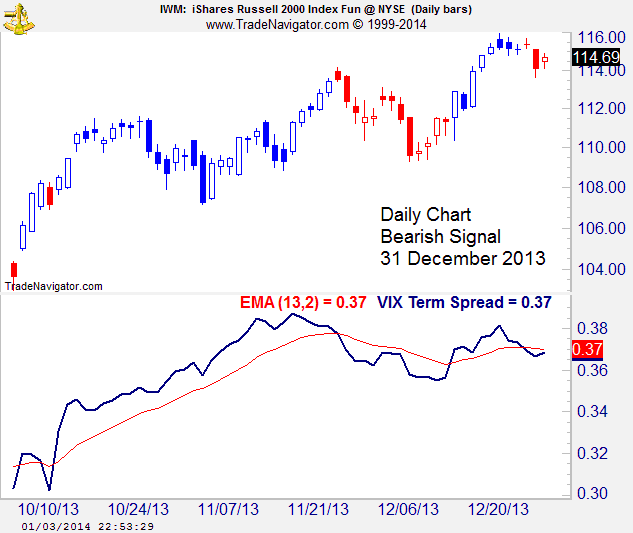
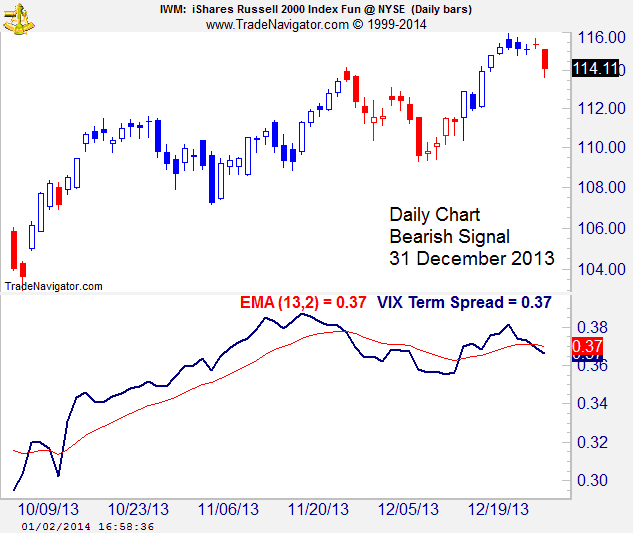
The volatility spread and its moving average both closed at 0.37 today. The system paints such a develop as a cross-over, so the daily chart shifted to a bullish signal. I am waiting to see what develops on Wednesday before concluding that prices may push meaningfully higher.
More bearish trend guidance
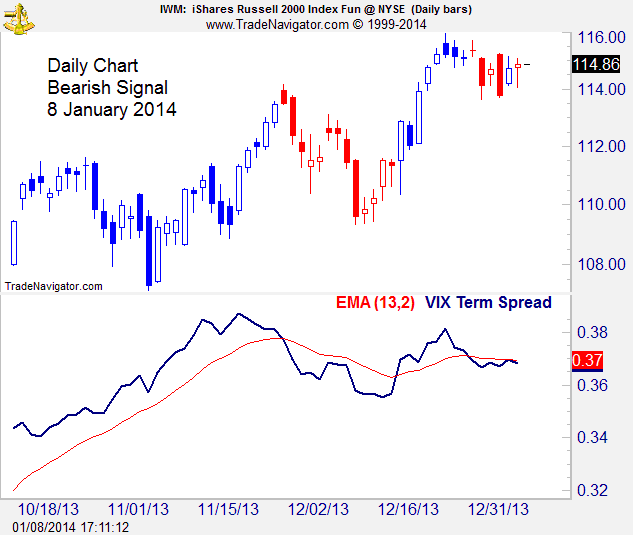
The volatility spread remains bearish.
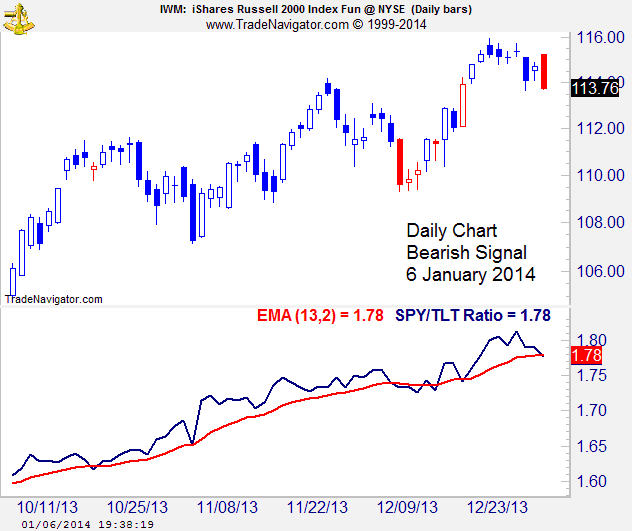
The interest rate/stocks spread turned bearish.
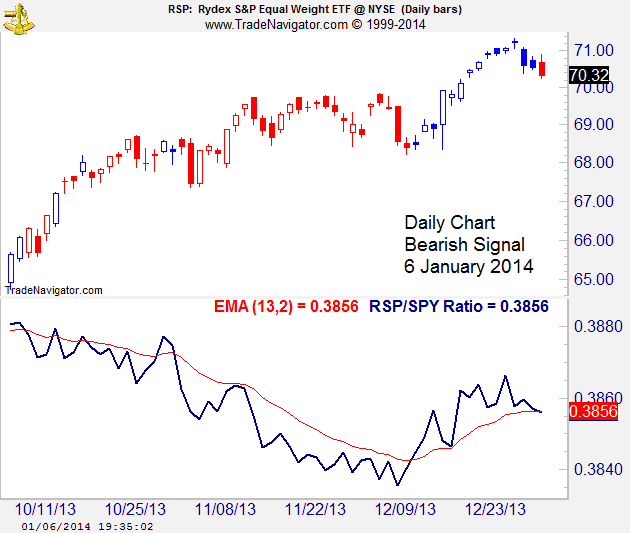
The equal weight/market weight spread turned bearish.
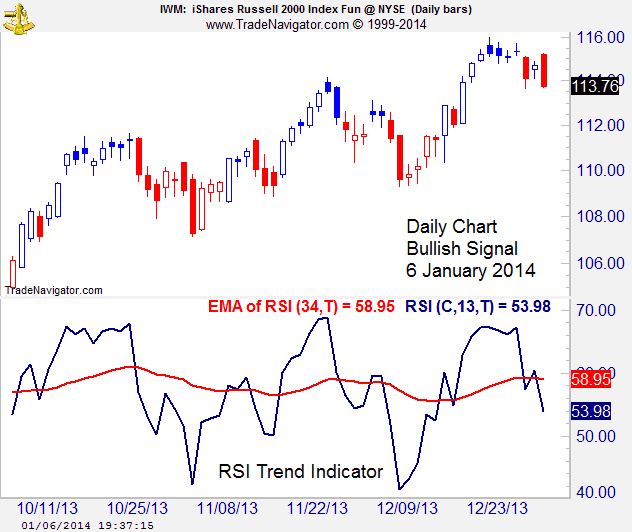
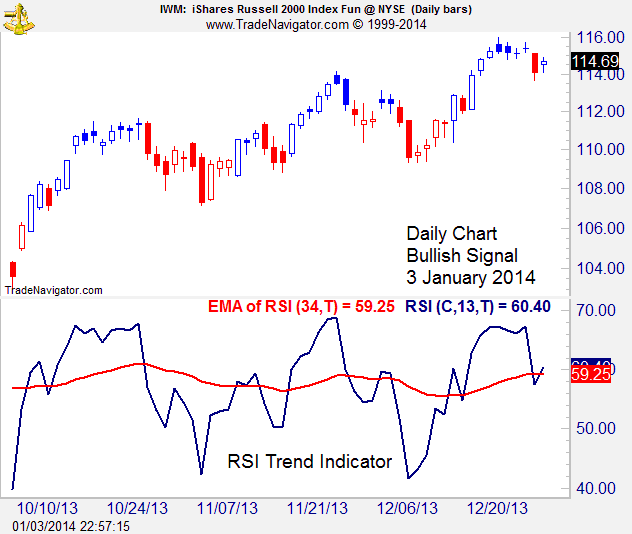
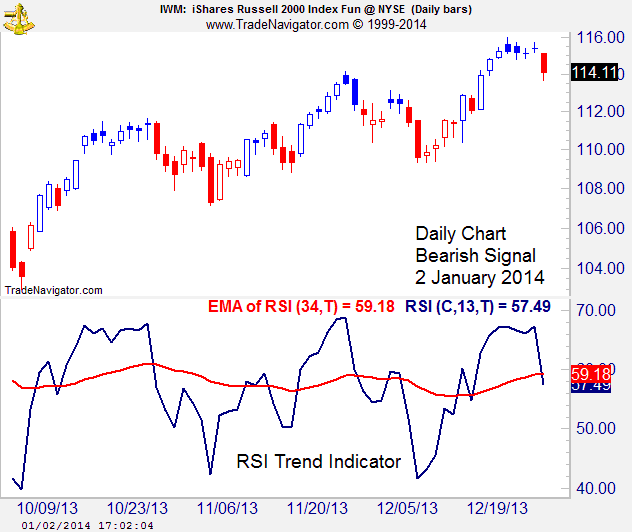
The RSI Trend signal returned to bearish after one day in bullish territory.
Mixed Trend Guidance
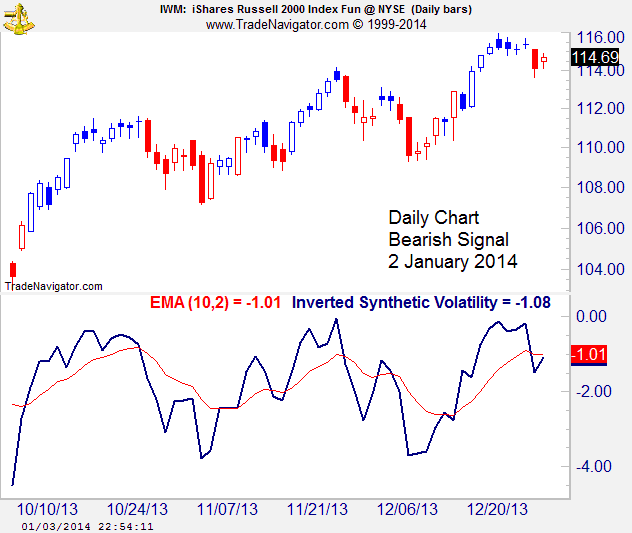
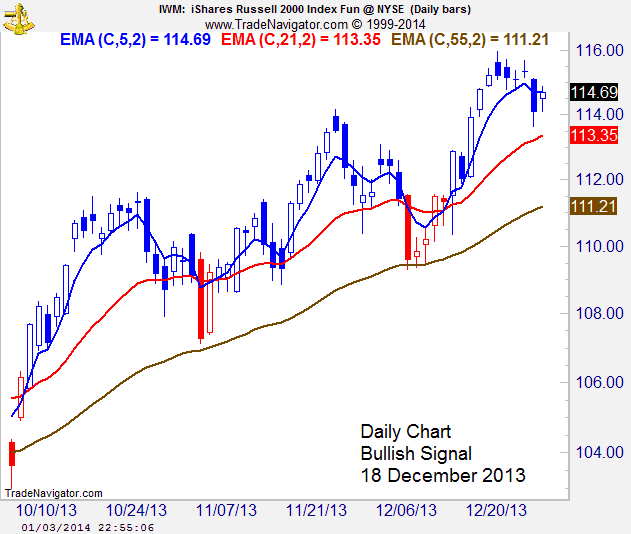
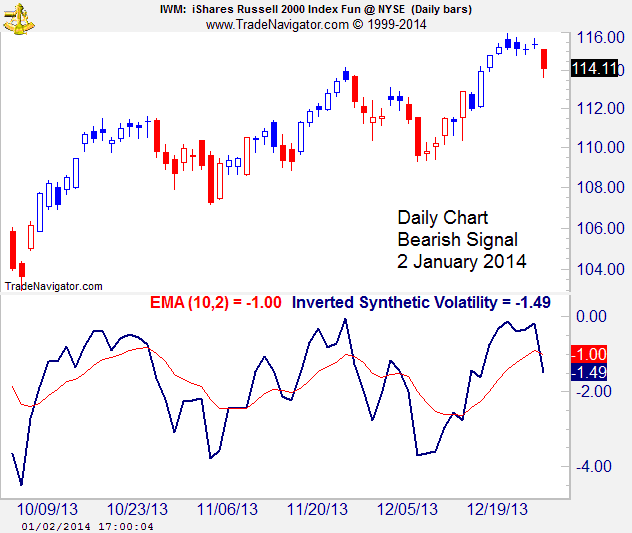
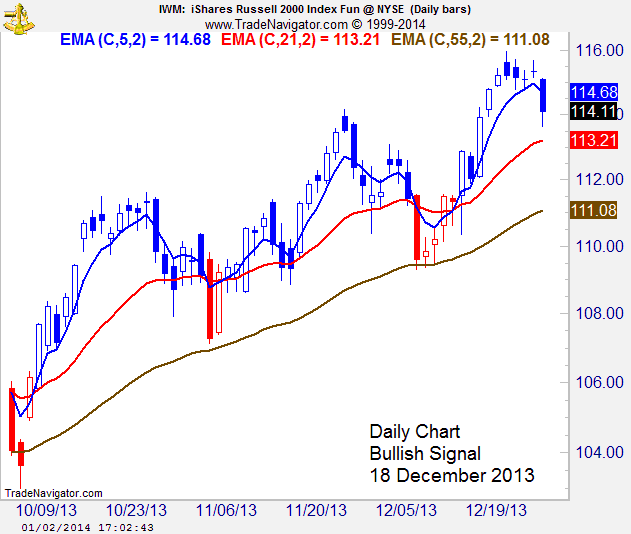
The volatility spread and synthetic volatility remains bearish, but the RSI Trend Indicator returned to bullish and the moving average study remains bullish. My focus is mainly the volatility spread chart when working with the Russell 2000 Index.
Trend Guidance increasingly bearish
Three of seven trend guidance systems I am watching are now bearish. The volatility spread turned bearish on 31 December, while synthetic volatility and the RSI trend indicator turned bearish on 2 January. One or two continue to look bullish, while several more (like the moving average crossover system) look as if they could turn bearish if recent weakness continues.
 Financial markets are predictable because segments of price action fit together in a limited number of patterns that are not random. Markets are unpredictable too because there is enough variability in the patterns to hide the trend at some stages of development. I am fascinated by the market and spend a lot of time working to identify price trends so I can exploit them for profit.